2018 Precipitation Trends: Wet In The Mid-Atlantic, Drought Expands In Southwest
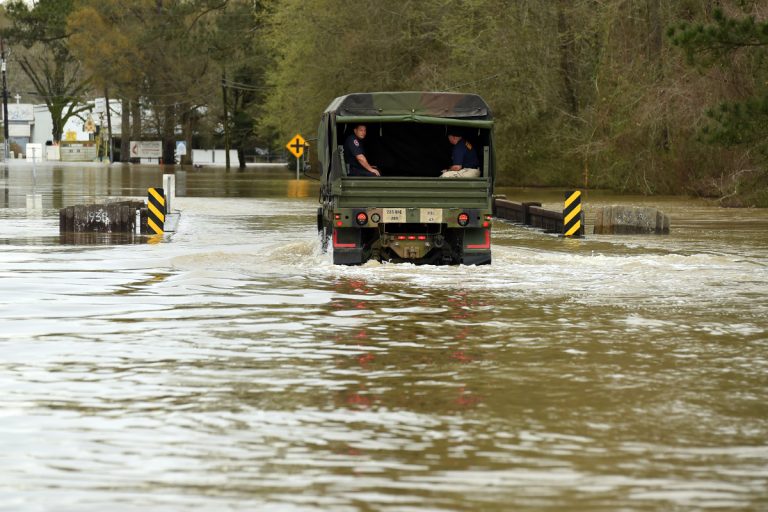
Earlier in July UBIMET meteorologists looked at temperature trends so far in 2018 for the US. This article will analyze precipitation trends across the US through the first 193 days of 2018.
2018 US Precipitation Data
Climate records from the Southeast Regional Climate Center (SERCC) show that 545 stations are having a wetter than average 2018, compared with 277 stations seeing a drier than average year. Stations in the SERCC database have a period of record of at least 30 years.
In general, the eastern half of the US and parts of the northern Rockies have experienced above average precipitation, while the Plains and Southwest have seen below average precipitation. As a result of the drier weather in the Southwest and Plains, drought conditions have worsened so far in 2018.
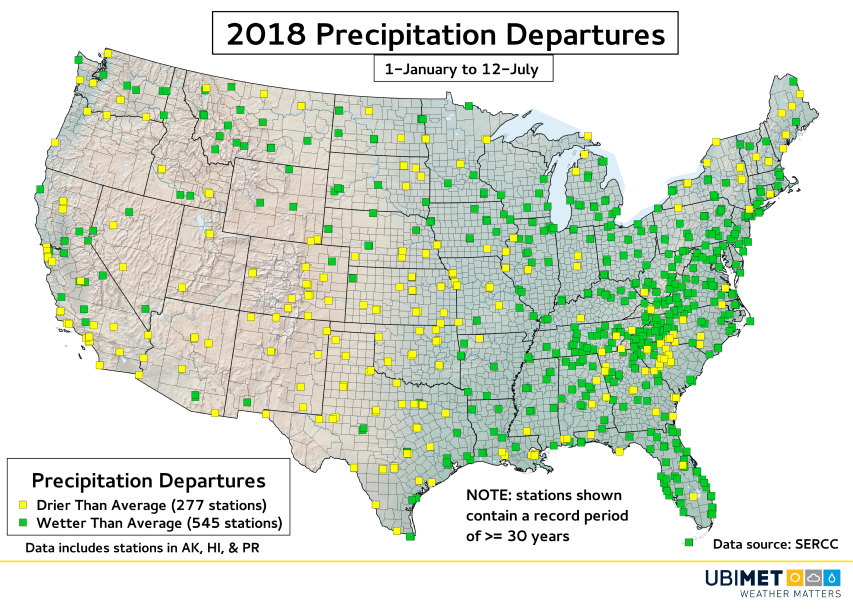
The ratio of wetter than average to drier than average locations is about 2:1.
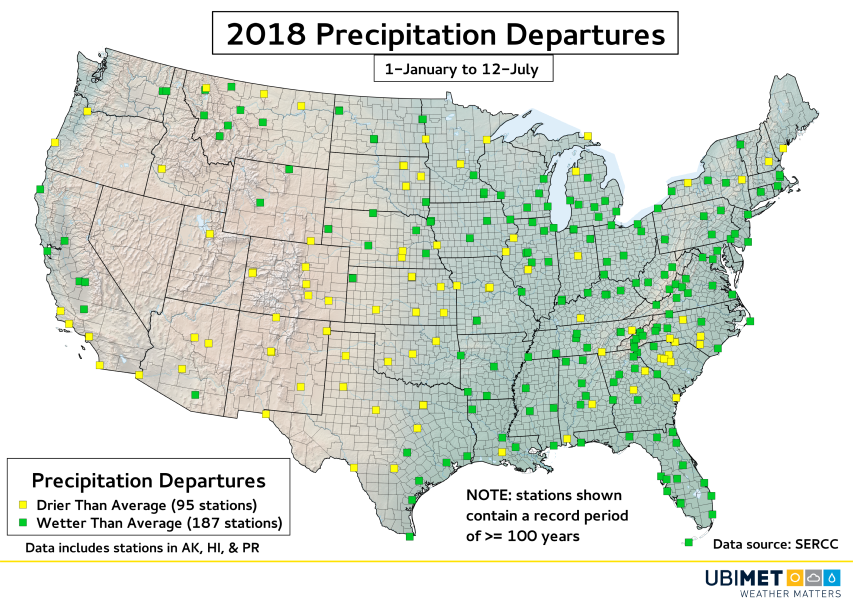
Out of the 822 US climate stations, 282 have a period of record that is greater than or equal to 100 years. Within this data set a similar ratio of wetter than average to drier than average locations is observed.
Looking even further into the data, 32 stations are seeing a top 3 wettest year on record through 12-July, while 16 locations are having a top 3 driest year.
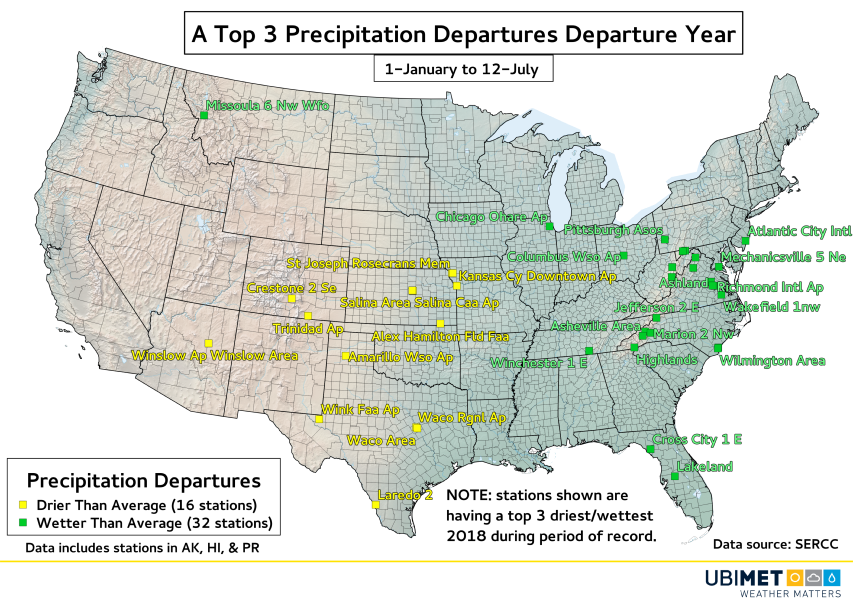
Richmond, Virginia and Wilmington, North Carolina, are off to their record wettest year for their period of record, which is 122 years and 144 years, respectively. Pittsburgh, Pennsylvania is having their 3rd wettest year on record with precipitation records dating back to 1875.